Google Chrome
Lab exercises are designed to help you gain practical experience with web technologies. You should elaborate on these exercises to confirm you understand and deploy the learning you find here in your own code.
In this exercise, we will use the developer tools in chrome to provide a developers view of a website.
Web browsers have two primary functions.
- They communicate with web servers using HTTP requests.
- They render HTML documents and related content.
They also have a secondary function, to act as platforms for developers to debug and inspect the inner workings of complex documents.
Choosing a browser
In this module we will use Google Chrome. The main reason for this is that it is the most popular browser and very likely will be used by the majority of your users.
You should already have Google Chrome open and be viewing this web page.
You may want to set Chrome as your default browser for the duration of this module if it isn’t already.
It looks something like this:
Google Chrome, showing this page under development
Almost all the window is taken up by the content of the page. The window includes tabs at the top to open multiple pages at once and a thin toolbar with the url and a few buttons like back, forward and reload etc..
If you want to remove this then pressing F11 should toggle full screen mode on and off.
Scroll around the page from a users perspective. Notice the structure.
There is a header at the top with the module title. There’s a navigation menu under the module title. At the end of the page, there is a footer with some additional links. These elements are common to all the pages in this site.
Also notice the button in the top-right corner which controls a navigation menu. This button doesn’t scroll with the rest of the page. Pressing it opens a menu which also doesn’t scroll.
Pressing the m key toggles the menu
The main content for this page includes a series of headings with paragraphs and images.
Some of the paragraphs are highlighted like this.
You can also try viewing this site on a mobile device, notice the differences.
Now we will inspect the structure of the page from a developers perspective.
The browser developer tools
The Chrome DevTools provide a developers view of an HTML document and the browser state. When developing a site, you should be regularly checking the developer tools to inspect the site, to try alternative solutions, to make sure you understand how the browser is interpreting your code and to emulate different devices.
Open the developer tools in your browser (you should be using Google Chrome). To open devTools I usually use F12 on linux, others use ctrl+shift+I or right-click and choose ‘inspect’. Alternatively, in the Chrome menu, select more tools and developer tools.
There are loads of ways to open the devTools. Here’s a video about that.
Wait. Don’t watch videos during the timetabled lab sessions! You can watch it later, and have a look at this playlist of dev tools videos from the google chrome developers channel, which has some good content.
Viewing the DOM
Through the developer tools panel, you can view and edit the HTML and CSS which make up the site and you can execute JavaScript on the page. In particular, we will be using the Elements panel to inspect the Document Object Model.
The Elements panel shows the Document Object Model (or DOM) as a nested structure containing all the elements of the page. The DOM is a representation of the page that is created when the browser parses and interprets your HTML file.
the page has changed since I took this screenshot
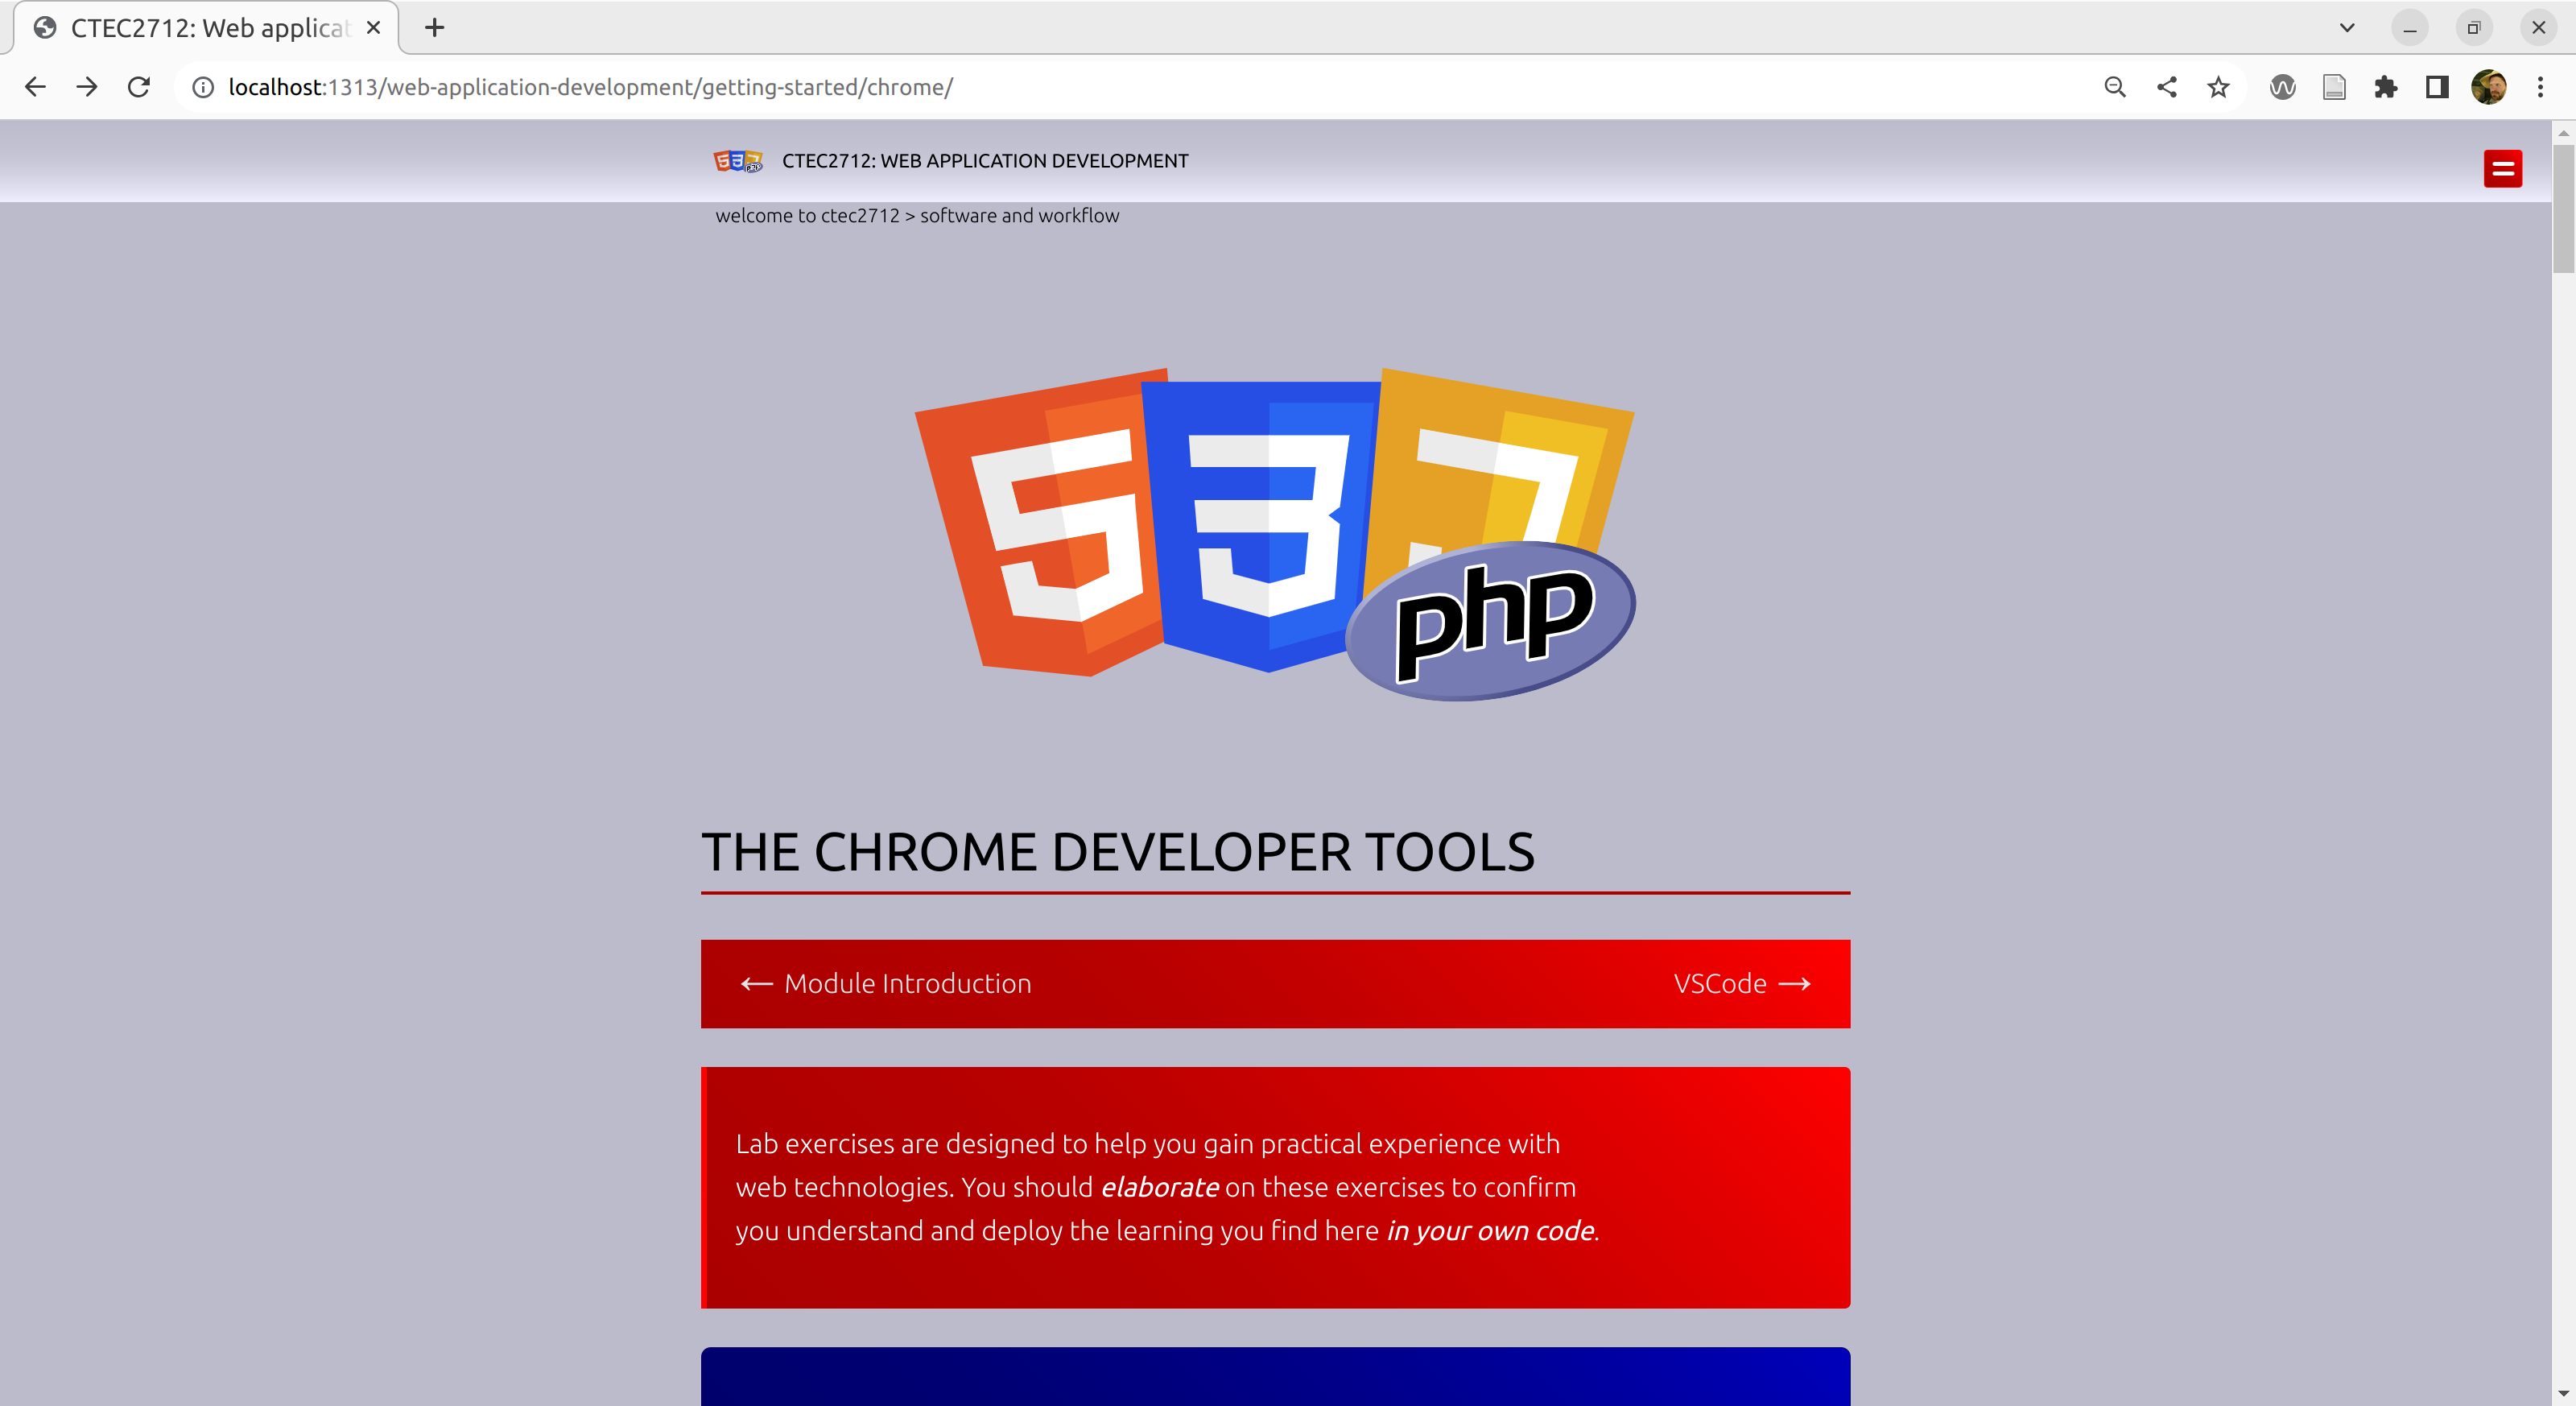
Try to find the following element within the nested structure.
This element is a
<blockquote>. You should see that it contains two<p>elements.The
<p>elements are paragraphs and they are separated by top and bottom margins.
Notice that when elements are selected in the developer tools, they are highlighted on the page. Also notice that the style rules of the selected element are provided in the lower panel.
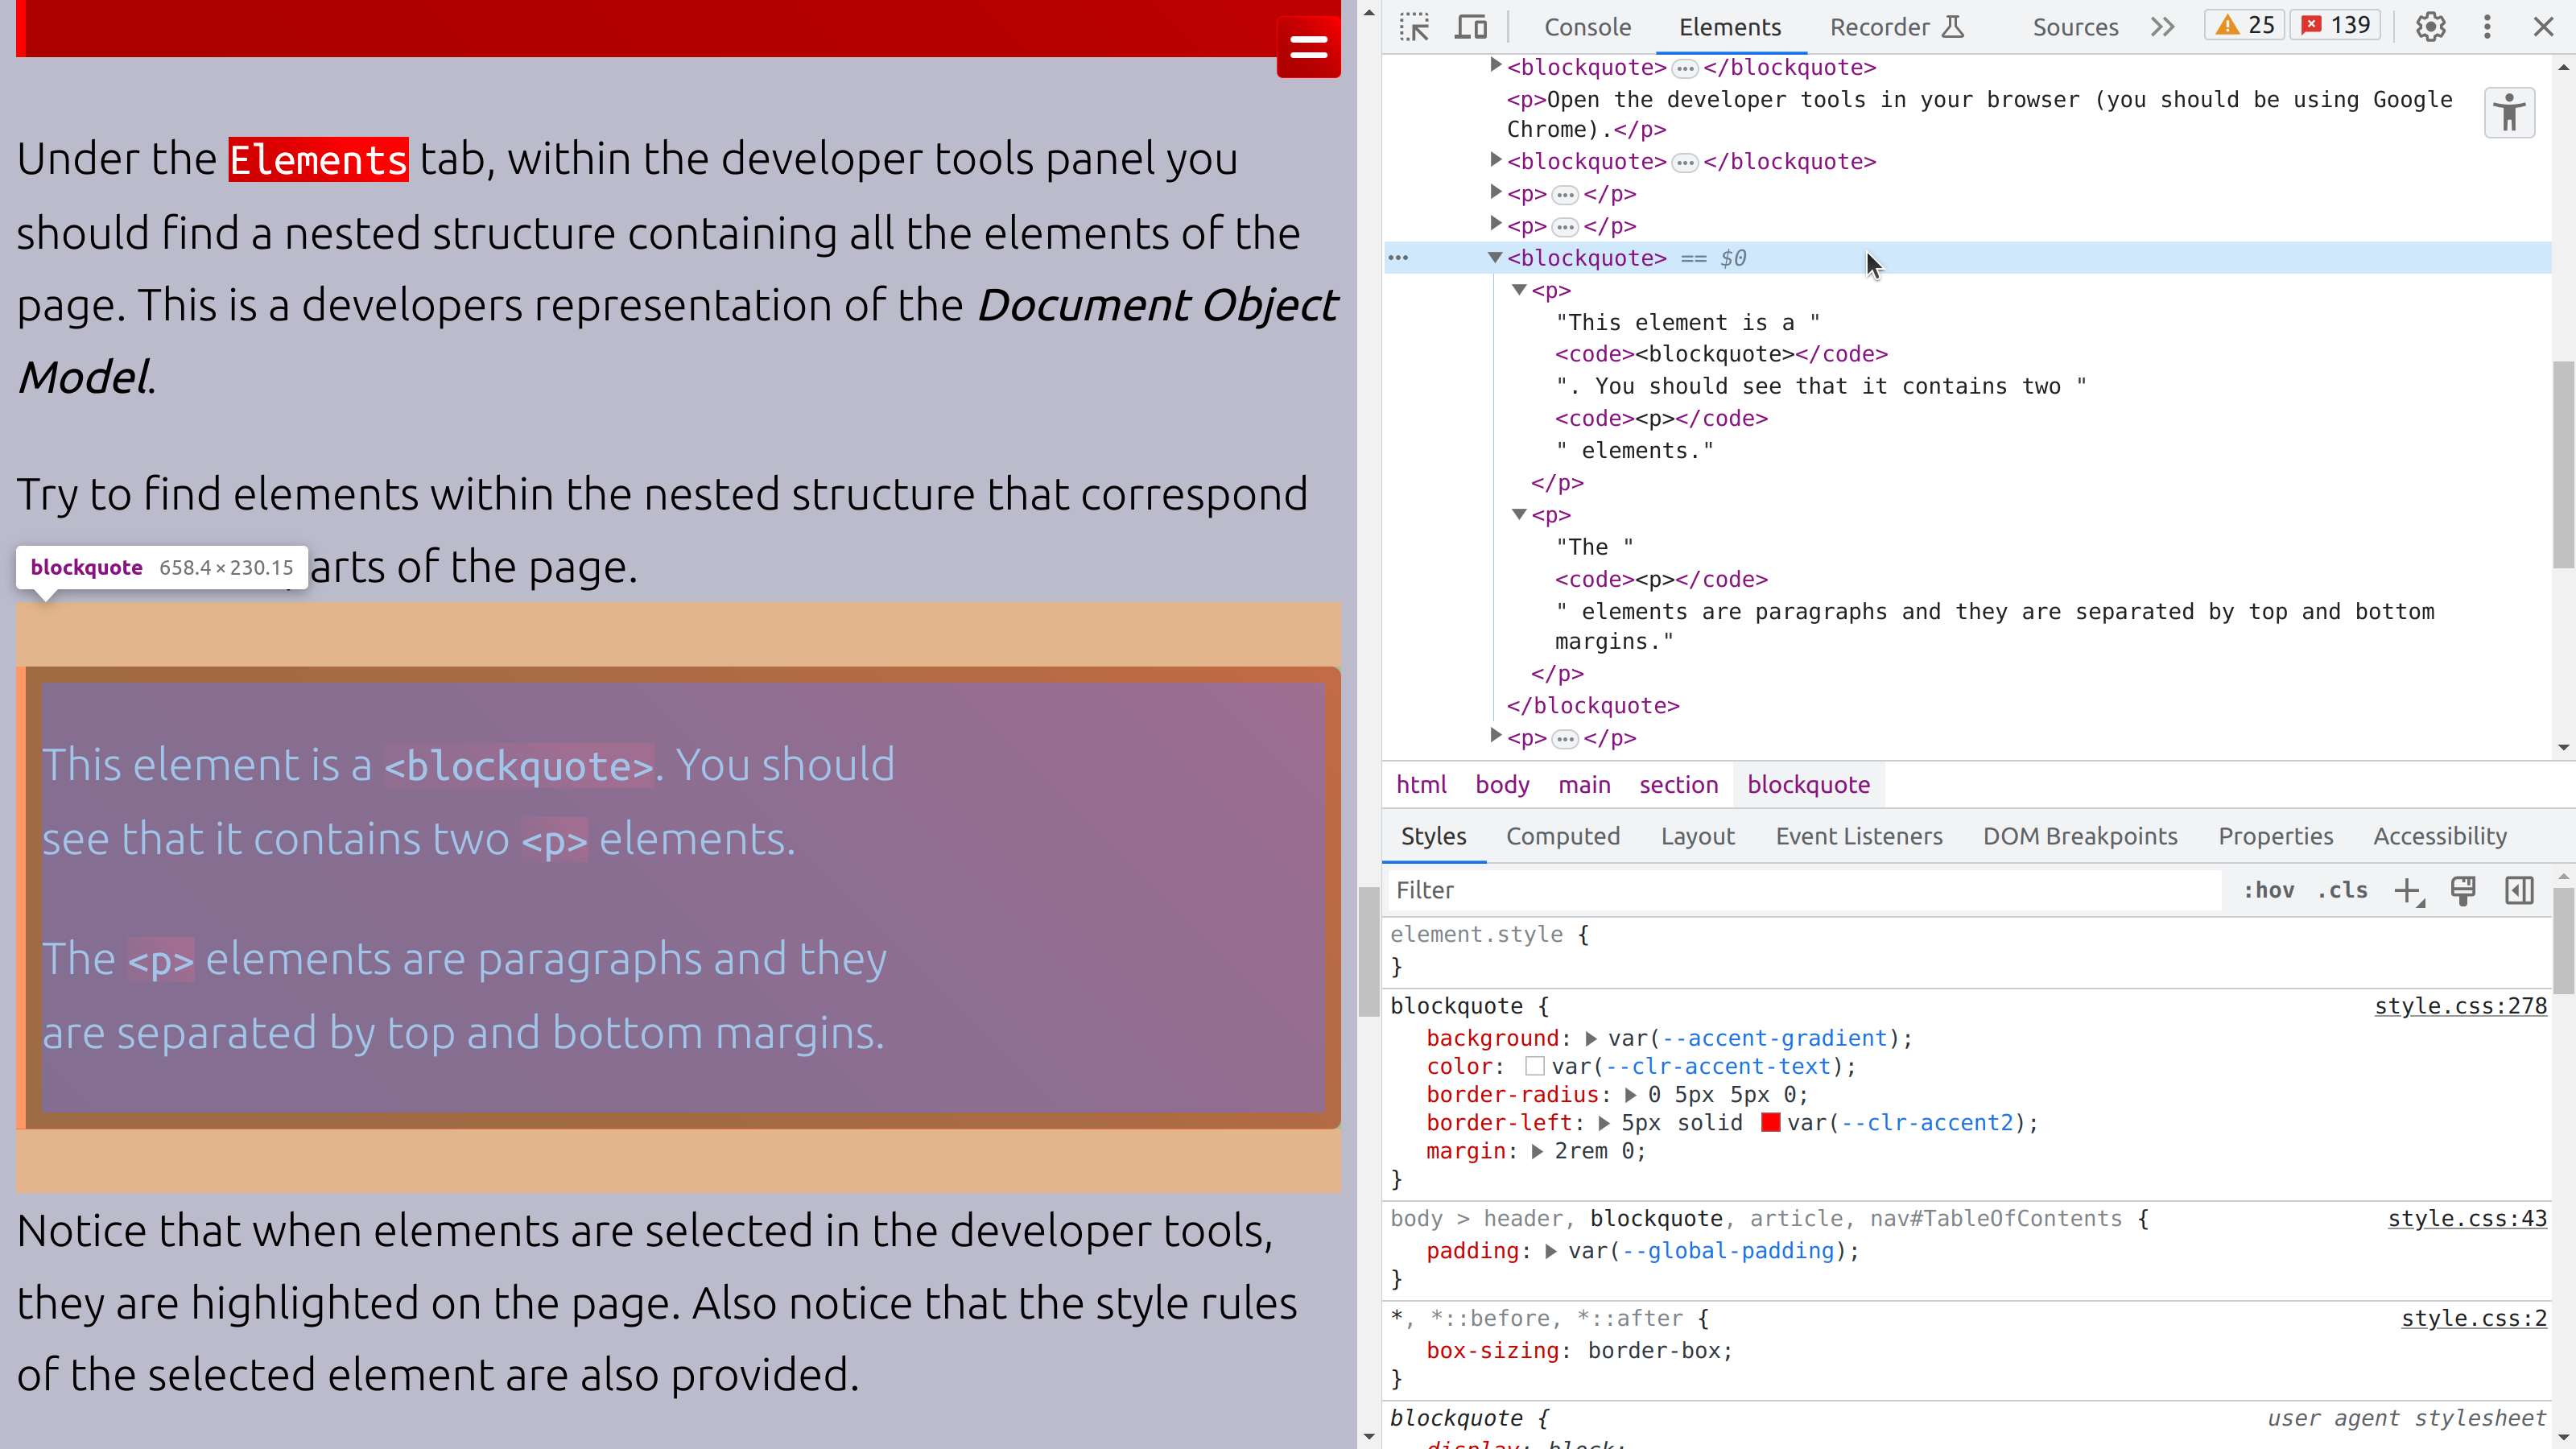
In the figure, the blockquote margins are highlighted in orange. The styles panel shows that blockquote elements have their margin property set to ‘2rem 0’. This means the top and bottom margins (known as the block margins) are set to ‘2rem’ and the left and right margins (known as the inline margins) are set to zero.
These are custom styles applied to this page.
Editing the DOM
Notice that the browser DOM is editable. If you select an element in the Elements panel and press delete, the element will be removed. If you select an element and press F2 (or double click the element) then you can overwrite the content.
editing the DOM
Pressing F2 again will save the changes to the DOM and the page will update.
The entire DOM can be replaced in this way. Though refreshing the page will reload the original document. Your changes are not permanent.
Try adding the following HTML into the page
<img src="https://placecats.com/600/200" alt="a random cat">Remember to press F2 to apply the change. You should see an image of a random cat from placecats.com.
Editing style rules
Style rules can be edited also. When an element is selected in the elements tab, you should see all the style rules applied to the selected element.
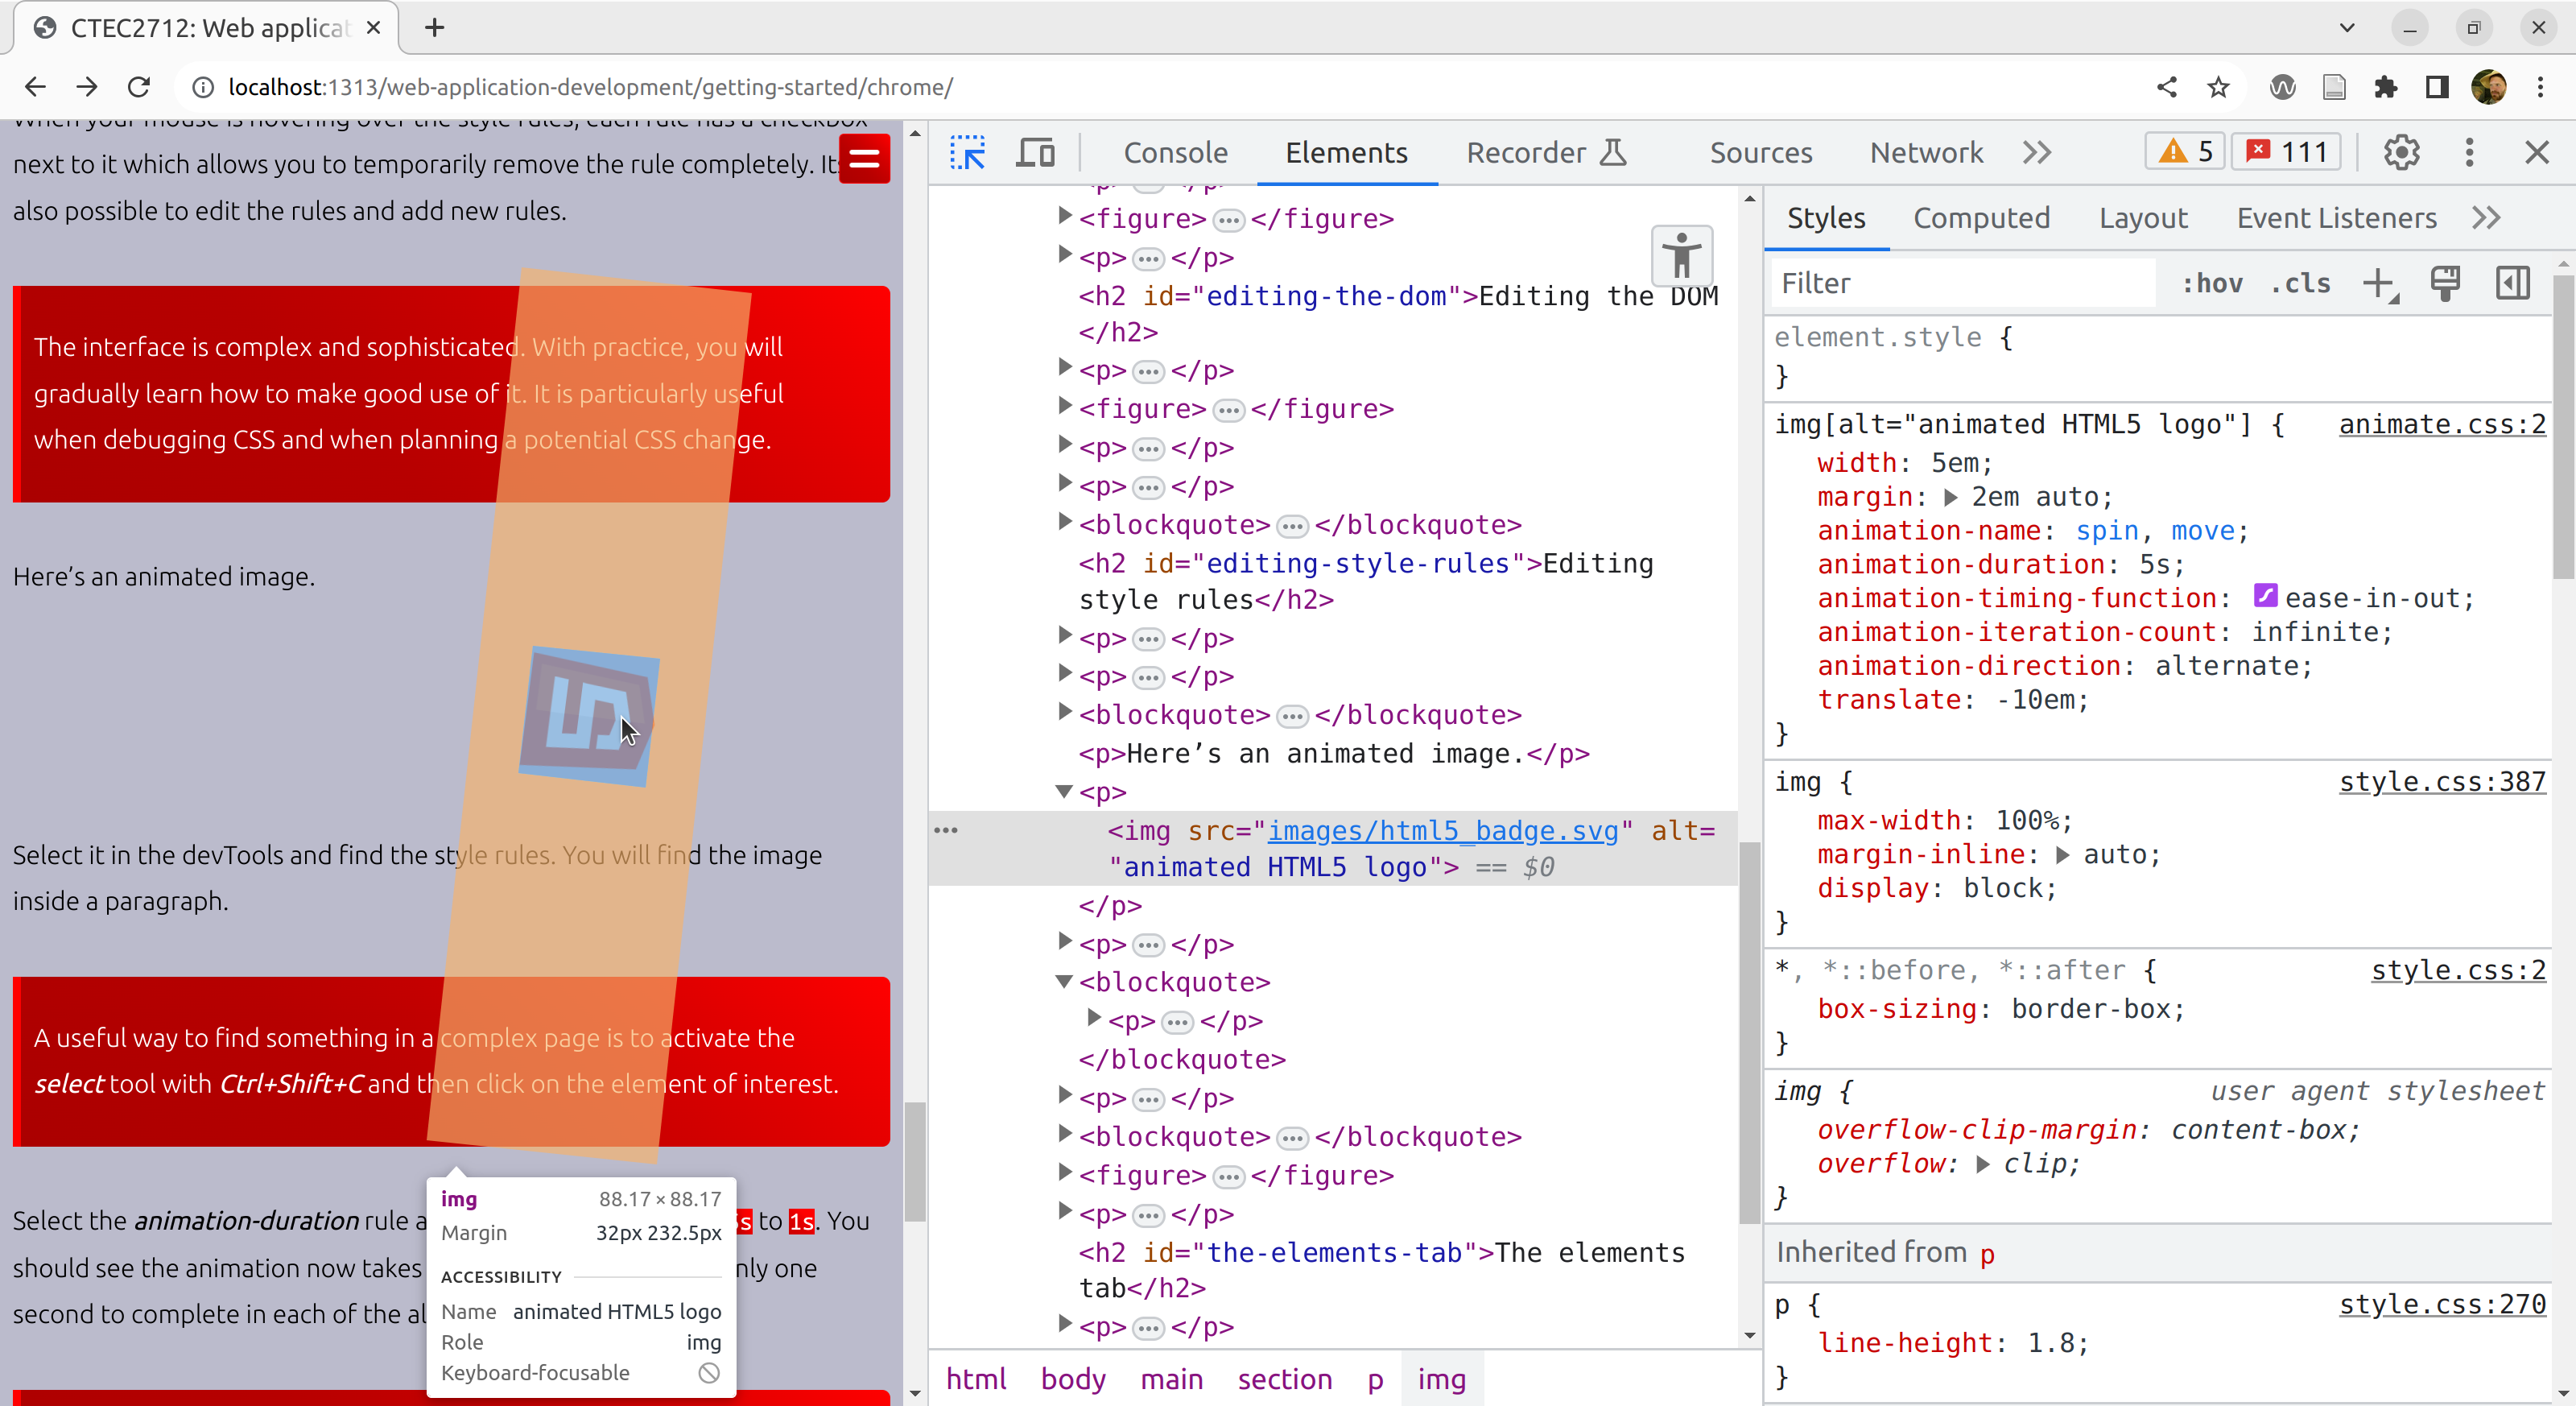
When your mouse is hovering over the style rules, each rule has a checkbox next to it which allows you to temporarily remove the rule completely. Its also possible to edit the rules and add new rules.
The interface is complex and sophisticated. With practice, you will gradually learn how to make good use of it. It is particularly useful when debugging CSS and when planning a potential CSS change.
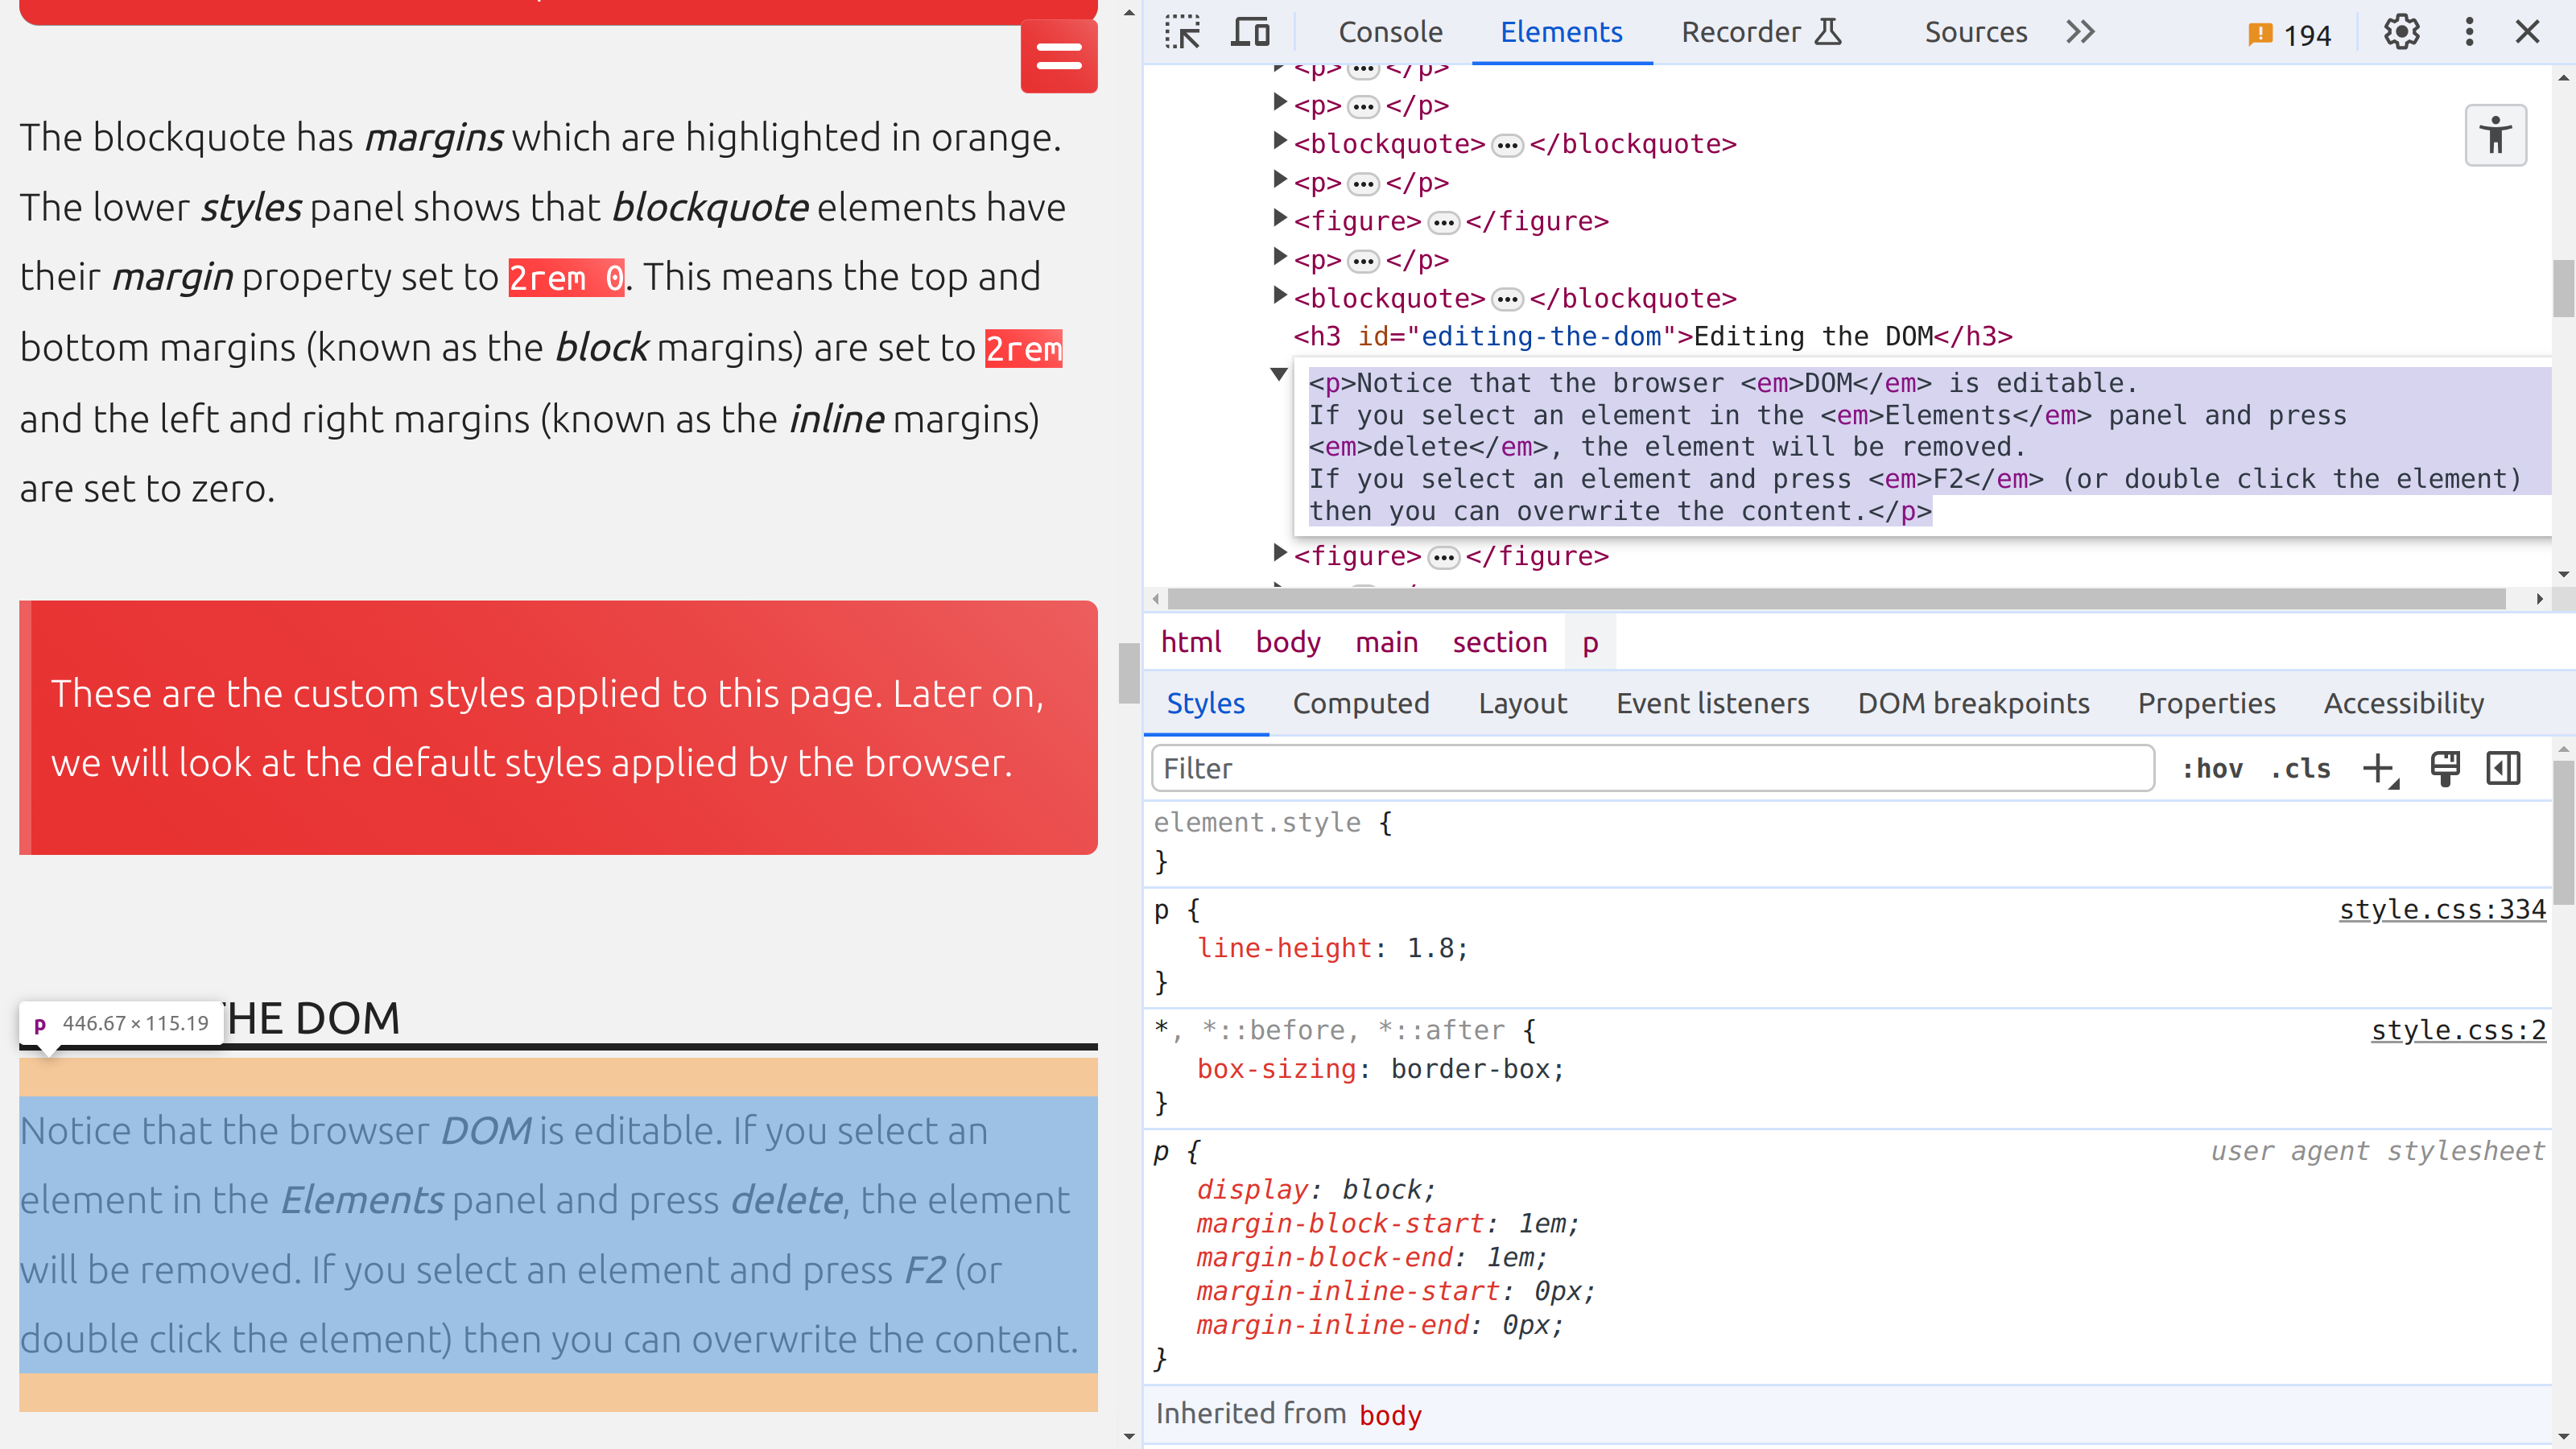
Here’s an animated image.
![]()
Select it in the devTools and find the style rules. You will find the image inside a paragraph.
A useful way to find something in a complex page is to activate the select tool with Ctrl+Shift+C and then click on the element of interest.
The animated element in the DOM
Select the animation-duration rule and change the value from 5s to 1s.
You should see the animation now takes place much faster, taking only one second to complete in each of the alternating directions.
You can learn more about CSS animations in the Mozilla Developer Network documentation
The JavaScript console
The console panel provides access to the javascript environment within the browser. It provides a convenient mechanism for debugging your JavaScript code.
Find the console tab and open the console.
You may see errors as in the figure, these are actually caused by the embedded youtube video above and the associated code.
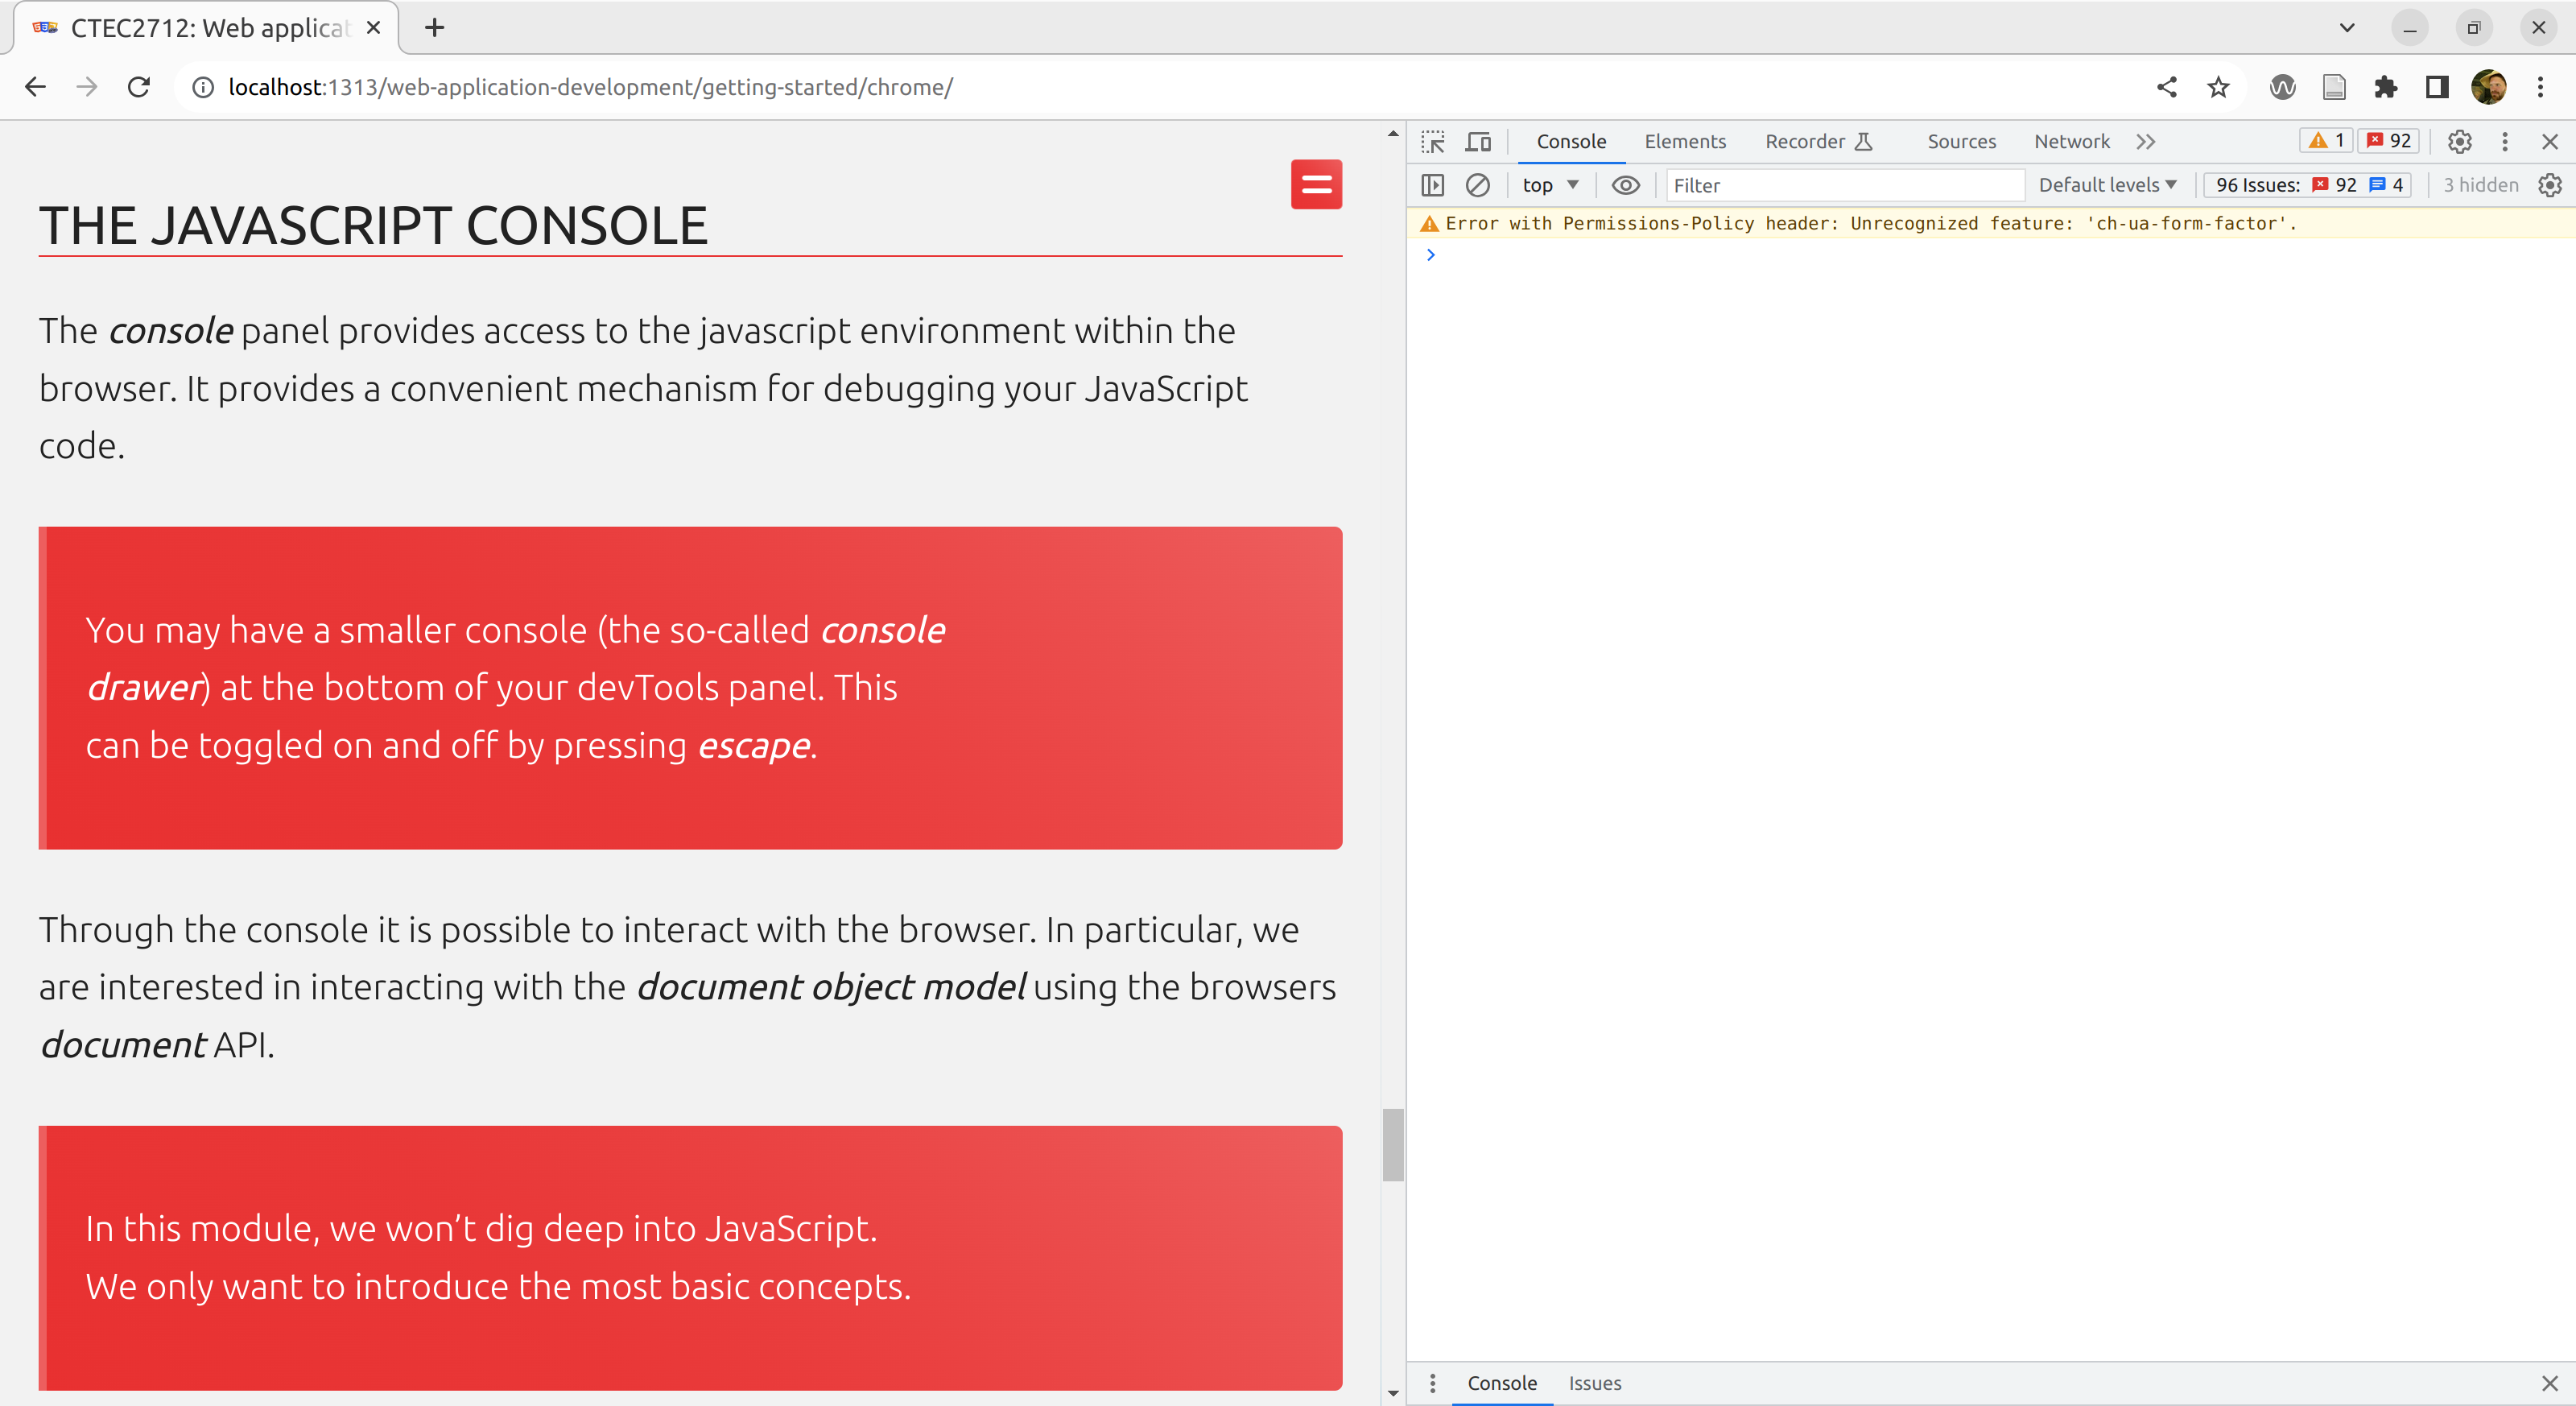
The JavaScript console
You may see a smaller console (the so-called console drawer) at the bottom of your devTools panel. This can be toggled on and off by pressing escape.
Through the console it is possible to interact with the browser. In particular, we are interested in interacting with the document object model using the browsers document API.
In this module, we won’t dig deep into JavaScript. We only want to introduce the most basic concepts.
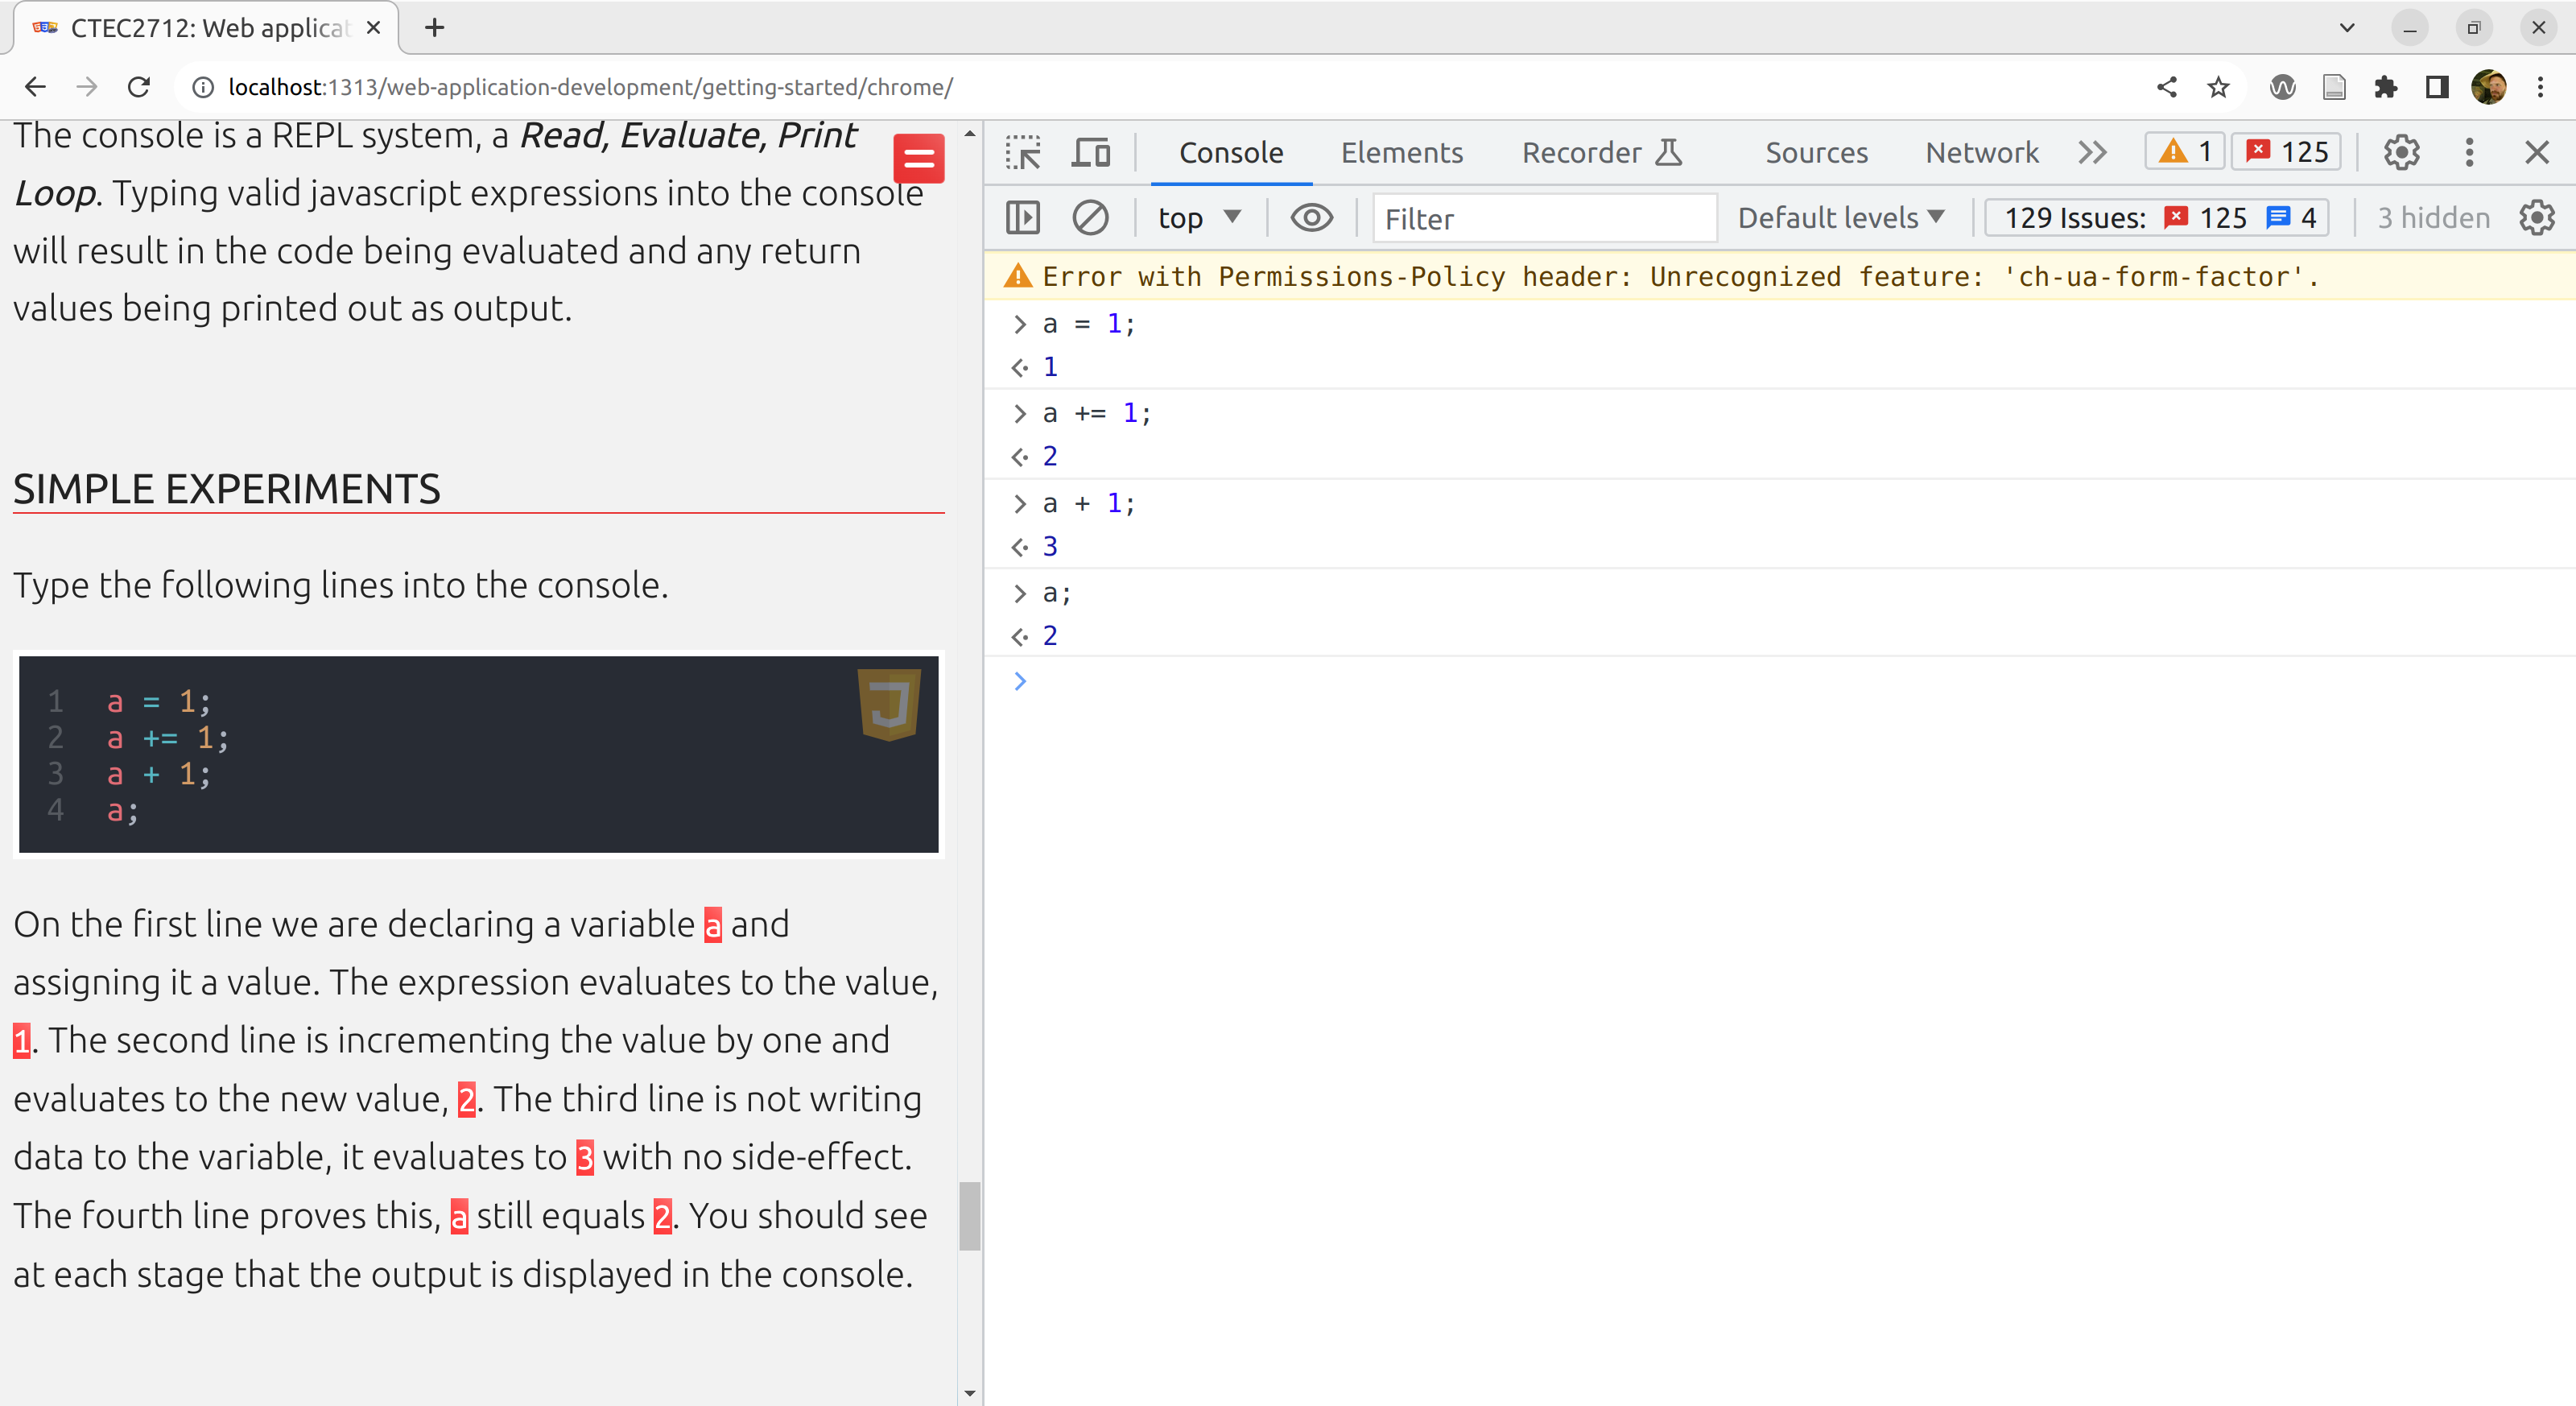
The console is a REPL system, a Read, Evaluate, Print Loop. Typing valid javascript expressions into the console will result in the code being evaluated and any return values being printed out as output.
Simple experiments
Type the following lines into the console.
| |
A simple experiment
The code is…
- declaring a variable
aand assigning it a value. The expression evaluates to the value,1. - Incrementing the value by one, which evaluates to the new value,
2. - Evaluating an expression with no side-effect, this outputs
3. - Proving that
astill equals2.
You should see at each stage that the output is displayed in the console.
Make sure you understand this. Ask your lab tutor if you want any clarification.
Querying the DOM
Often we want to access elements in the document and manipulate them. DOM manipulation is a common use of JavaScript.
Type the following into the console.
document.querySelectorAll('p')
The above line is calling the querySelectorAll method of the global document object.
This method looks through the entire DOM and finds all elements that match your query.
In this case, we are looking for all the <p> elements in the page.
The query syntax is exactly the same as CSS selectors, we will introduce selectors in future exercises.
You should see the result is a NodeList object which contains lots of p objects.
We can access the individual node items using square bracket notation.
For example, this code will extract the first paragraph from the page.
paragraphs = document.querySelectorAll('p');
p = paragraphs[0];
This can be reduced to the following:
p = document.querySelectorAll('p')[0];
or, for accessing the first matching element, simply use querySelector.
p = document.querySelector('p');
Either way, you should see a specific paragraph element has been extracted from the page.
Scroll to the top of the page to find the first paragraph, then try the following code.
| |
You should see that the page responds to each line of code in turn.
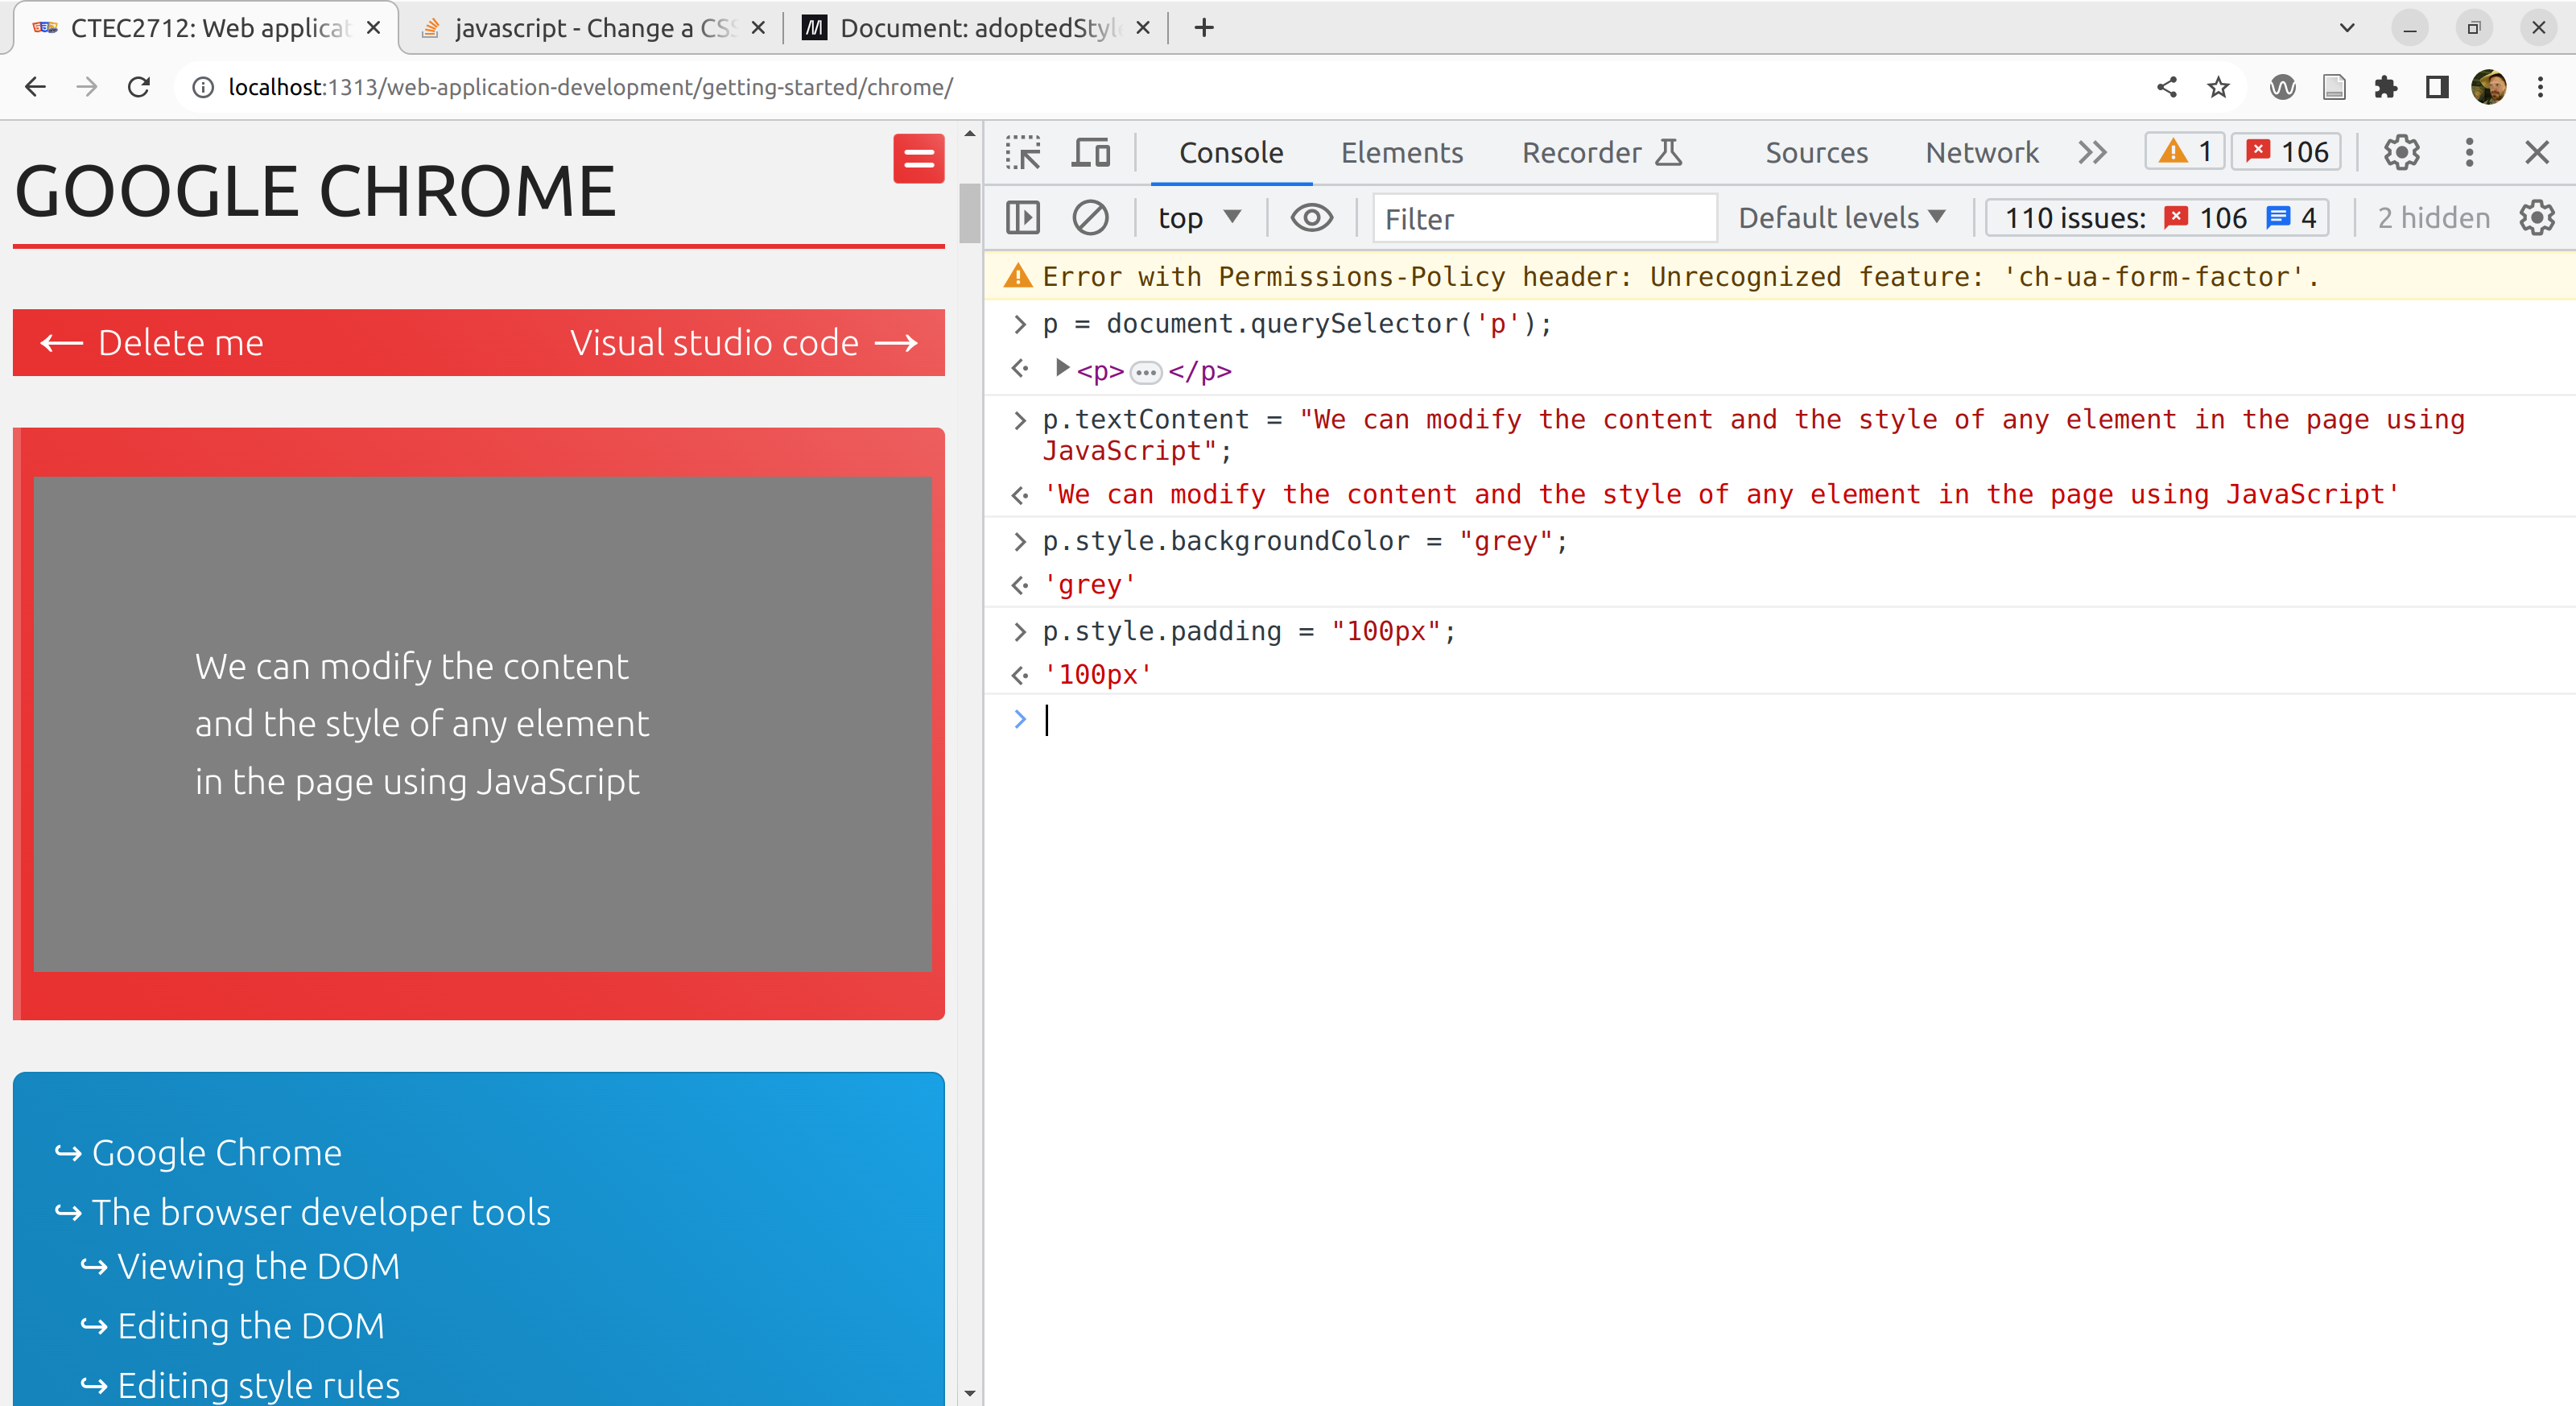
DOM manipulation
Challenges
Take 10 minutes to…
- Explore the entire website through the devTools, try to understand how it is structured.
- Locate the network panel and reload the page (what is all this stuff?).
- Explore the developer tools more widely, see what you can find in there.
- Ask questions if you have them.
Some of this will be outside the scope of this module, but we will be happy to receive your questions.
Conclusions
We have seen that the developer tools provide a window into the details of how a document is put together. They can also be used to make temporary changes to the document object model within the browser.
These tools are critical when working on front end web development.